CSS3+jQuery的互动走势图
在线演示
在本教程中,我们将编写一个交互式图形使用jQuery和CSS3。我们将使用jQuery的流行的绘图插件“Flot”。Flot是一个纯粹的JavaScript,jQuery的绘图库。这个插件很简单,但强大到足以创造出一些漂亮的和交互式图表。HTML MARKUP<!-- Graph HTML --><div id="graph-wrapper"> <div class="graph-info"> <a href="javascript:void(0)" class="visitors">Visitors</a> <a href="javascript:void(0)" class="returning">Returning Visitors</a> <a href="#" id="bars"><span></span></a> <a href="#" id="lines" class="active"><span></span></a> </div> <div class="graph-container"> <div id="graph-lines"></div> <div id="graph-bars"></div> </div></div><!-- end Graph HTML -->
jQuery and Flot Plugin
<script src="https://ajax.googleapis.com/ajax/libs/jquery/1.7.2/jquery.min.js"></script><script src="js/jquery.flot.min.js"></script><script>$(document).ready(function () { // Graph scripts here});</script>
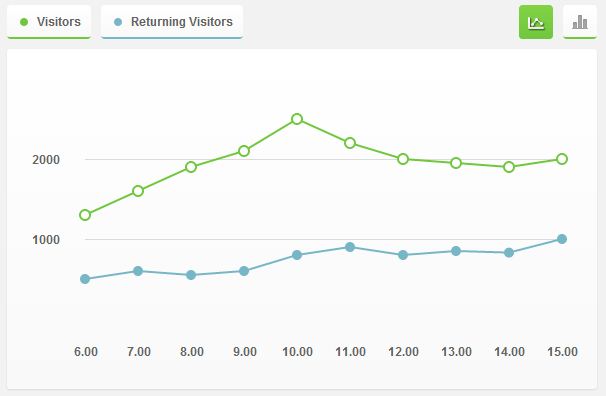
Graph Data
var graphData = [{ // Visits data: [ [6, 1300], [7, 1600], [8, 1900], [9, 2100], [10, 2500], [11, 2200], [12, 2000], [13, 1950], [14, 1900], [15, 2000] ], color: '#71c73e' }, { // Returning Visits data: [ [6, 500], [7, 600], [8, 550], [9, 600], [10, 800], [11, 900], [12, 800], [13, 850], [14, 830], [15, 1000] ], color: '#77b7c5', points: { radius: 4, fillColor: '#77b7c5' } }];
Load Graphs
// Lines$.plot($('#graph-lines'), graphData, { series: { points: { show: true, radius: 5 }, lines: { show: true }, shadowSize: 0 }, grid: { color: '#646464', borderColor: 'transparent', borderWidth: 20, hoverable: true }, xaxis: { tickColor: 'transparent', tickDecimals: 2 }, yaxis: { tickSize: 1000 }}); // Bars$.plot($('#graph-bars'), graphData, { series: { bars: { show: true, barWidth: .9, align: 'center' }, shadowSize: 0 }, grid: { color: '#646464', borderColor: 'transparent', borderWidth: 20, hoverable: true }, xaxis: { tickColor: 'transparent', tickDecimals: 2 }, yaxis: { tickSize: 1000 }});
Graph Container Styles
/* Resets */.graph-container,.graph-container div,.graph-container a,.graph-container span { margin: 0; padding: 0;} /* Gradinet and Rounded Corners */.graph-container, #tooltip, .graph-info a { background: #ffffff; background: -moz-linear-gradient(top, #ffffff 0%, #f9f9f9 100%); background: -webkit-gradient(linear, left top, left bottom, color-stop(0%,#ffffff), color-stop(100%,#f9f9f9)); background: -webkit-linear-gradient(top, #ffffff 0%,#f9f9f9 100%); background: -o-linear-gradient(top, #ffffff 0%,#f9f9f9 100%); background: -ms-linear-gradient(top, #ffffff 0%,#f9f9f9 100%); background: linear-gradient(to bottom, #ffffff 0%,#f9f9f9 100%); -webkit-border-radius: 3px; -moz-border-radius: 3px; border-radius: 3px;}/* Graph Container */.graph-container { position: relative; width: 550px; height: 300px; padding: 20px; -webkit-box-shadow: 0px 1px 2px rgba(0,0,0,.1); -moz-box-shadow: 0px 1px 2px rgba(0,0,0,.1); box-shadow: 0px 1px 2px rgba(0,0,0,.1);} .graph-container > div { position: absolute; width: inherit; height: inherit; top: 10px; left: 25px;} .graph-info { width: 590px; margin-bottom: 10px;}
【CSS3+jQuery的互动走势图】相关文章
3. jquery simulate插件模拟web用户的互动操作
4. HTML5的互动股票图形数据HumbleFinance
本文来源:https://www.51html5.com/a1180.html